Confusion Matrix
General Idea on Confusion Matrix
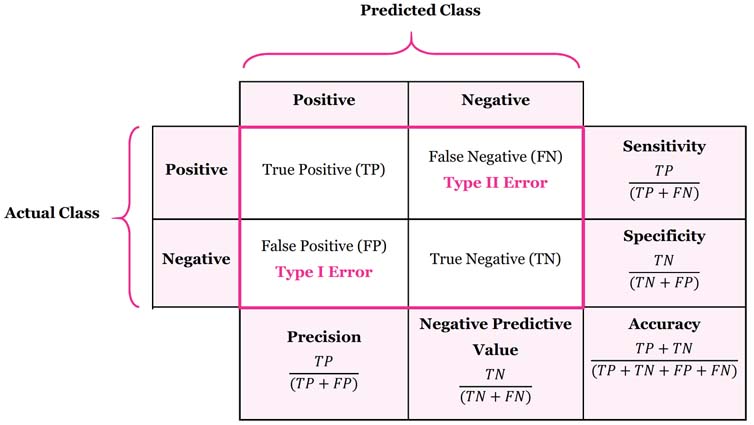
Confusion Matrix is a performance measurement for machine learning classification
Example on Patients data
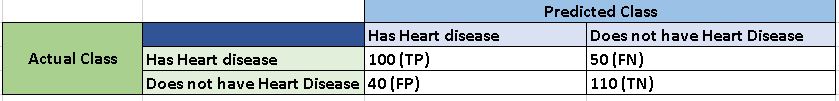
- 100 True Positives - Patients with heart disease classified correctly
- 110 True Negatives - Patients without heart disease classified correctly
- 40 False Negatives - Patients who have heart disease but algorithm did not classify
- 50 False Positives - Patients who didn’t have heart disease but algorithm classified positive
-
Precision : TP / (TP+FP) = 100/(100+40) = 100/140 = 71.4%
-
Sensitivity (Recall) : TP / (TP+FN) = 100/(100+50) = 100/150 = 66.7%
-
Specificity : TN / (TN+FP) = 110/(110+40) = 110/150 = 73.3%
-
Negative Predict value : TN / (TN+FN) = 110/(110+50) = 110/160 = 68.7%
-
Accuracy : TP + TN / (TP+TN+FN+FP) = (100+110)/(100+110+40+50) = 210/300 = 70%
-
F1-Score : 2 x Recall x Precision / (Recall + Precision) = (2 x 0.67 x 0.71) / (0.71+0.67) = 0.95/1.38 = 68.8%
(F1-Score is the harmonic mean of Precision and Recall . It gives a better measure of the incorrectly classified cases than the Accuracy Metric.)
Notes
- A system with high recall but low precision returns many results, but most of its predicted labels are incorrect when compared to the training labels.
- A system with high precision but low recall is just the opposite, returning very few results, but most of its predicted labels are correct when compared to the training labels.
- An ideal system with high precision and high recall will return many results, with all results labeled correctly.
- Accuracy -> When TP and TN are more important
- F1-score -> When FN and FP are crucial.
- Accuracy -> Better when the class distribution is similar
- F1-score -> Better when the class distrbution is imbalanced